Tip 6
tip #6
Cell performance indicator
Did you know that since v11.113 it is possible to see the performance of a cell in one glance? We have developed a function in which each cell is assigned a performance value based on the last ten production orders completed in the cell.
In order to be ‘close to the ball’ it is important to know how a production cell is performing. What is the flow and performance at this moment? Because this is a discrete production, it always concerns the last few orders. To get an idea of how a production cell is performing, we have developed the cell flow meter. The cell flow meter gives one number between 0 and 10 that indicates how a production cell is currently performing and whether or not there is a need to intervene or give compliments.
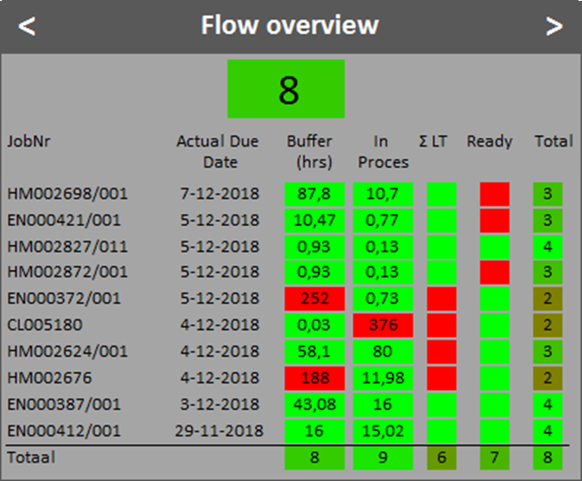
The cell flow meter indicates the flow of the last 10 jobs and a total score for the last 10 jobs. This to get a picture of how the cell is doing at the moment, regardless of whether there is much or little work (therefore the last 10).
The more green the better. And the greener the better.

|
Top number |
The PROPOS cell flow number. This indicates in one digit between 0 and 10 the current status of the cell. Equal to the total at the bottom right. |
|
JobNr |
The job number. |
|
ActualEndDT |
At what time the job has left the cell. |
|
Buffer (h) |
The number of working hours this job has been in the buffer. Green = less than pre-calculated, red = more than pre-calculated. |
|
In Process (h) |
The number of working hours that this job has been in process. Green = less than pre-calculated, red = more than pre-calculated. |
|
Σ LT |
Buffer + In Process time. Note: even if one of the above two is red, it can still be green. Green = less than pre-calculated, red = more than pre-calculated. |
|
Ready on time |
Was the job ready before the planned end date? Green = yes, red = no |
|
Total (column) |
Of the 4 KPI’s before, how many were green? That is the score for the job (score 0 to 4 possible). The higher the score, the greener the box. 0 = completely red, 4 = completely green. |
This is how the calculcation works
Below the KPIs per job a total is calculated. This can be seen as the average performance of the cell over the last 10 jobs. Here all completely green boxes of the jobs in the relevant column are counted. The total at Buffer (h) is 8 because there were 8 completely green boxes. Σ LT is set to 6 because there were 6 completely green boxes. The total at Total is the average of the previous 4 totals and can therefore be between 0 and 10 for 10 jobs in the list, where 0 is the worst and 10 is the best. This number in the lower right corner shows the average flow performance of the production cell on a scale of 0 – 10.
The numbers below the total line are always converted to a 0 – 10 scale so that they can always be compared / so that at a glance it is clear how the average should be interpreted.
The cell flow meter can be activated per cell in Maintenance > Cell settings > Display.
In the dashboard a tab has been added that shows the current performance indicator of all active cells. Clicking on a cell shows the details of that cell as explained in the mentioned updates magazine.
More PROPOS
Want to know more about PROPOS? On LinkedIn we regularly post videos, articles and cases.

